Exhibition Reflection
For this exhibition we set it up as if the audience was a customer and we were helping them with their problems in taxes, student loans, and credit cards. The audience would choose a problem and we would work through the steps to educate them about the process. I chose to help people with their tax issues. Our class had already spent weeks learning about each apparatus and taxes really stood out to me. These skills have definitely prepared me for the future because there is no way around these three things. This exhibition is hard to compare to any other exhibition because it is so different. I liked this format best out of all the exhibitions because the audience got to interact with us instead of just asking questions.
Linear Regression Project
Procedures
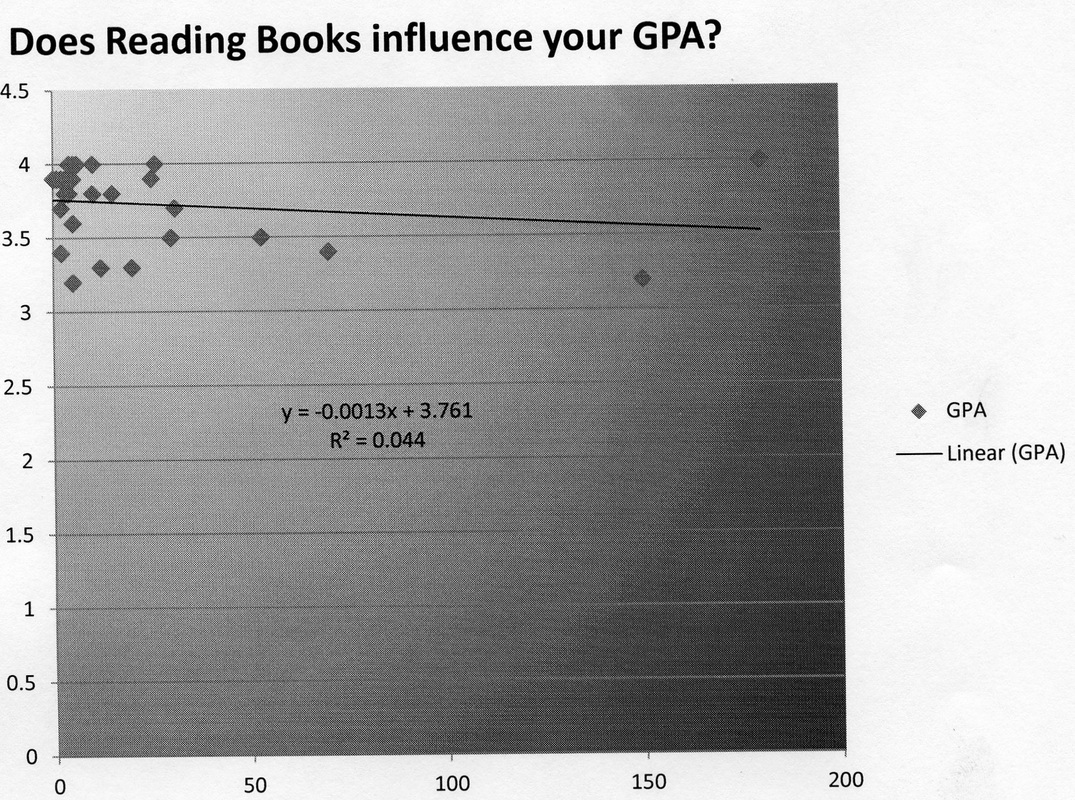
My experiment was to try to see if your Grade Point Average (GPA) was influenced by how many books you read. Since it was too early in the year to know what your GPA was, I collected data by asking my entire math and X-block how many books they read last year and what their GPA was. I recorded the data first on a sheet of scrap paper but then transferred it to a word document.
Prediction
Due to the low R and Rsquared values, predicting y values not in my data range would result in inaccurate guessing, and my estimates would not be reliable. If I had to guess for two y-values not in my data I would use this equation from both excel and the TI-84: y=-0.0012x +3.76. So if someone read 100 books there GPA could possibly be 3.88. Another example would be if someone read 45 books, their GPA could be 3.814. My predictions could possibly be accurate but because each person is very different from the next it is hard to say if this would actually work. I am not confident in my predictions.
Reflection and Conclusion
I had hoped that my data would show that the more books you read, the higher your GPA would be. Sadly, my data showed the opposite. The slope from my experiment is negative, which means that the more books you read makes your GPA go down. Looking on the bright side of things, it is a very small negative which means that the more books you read doesn't decrease your GPA drastically. The human race may have some hope yet! The y-intercept (3.76) means that if someone didn't read any books, they would score a GPA of roughly 3.76 meaning that they would get mostly B’s. The results of my experiment were not expected and showed the opposite of my hypothesis. I learned that not only do teenagers not read enough books, but that maybe not reading helps them. Maybe the books they read distract them from their school work or they spend too much time reading and not enough time studying. My equation (y=-0.0012x +3.76) said that the fewer books you read, the higher your GPA will be, except in the case of the few outliers.